- Home
- Python
- Python là gì ?
- Python Cài đặt
- Python Tạo Project
- Python Cú pháp cơ bản
- Python Khai báo biến
- Python Các phép toán
- Python Lệnh if - else
- Python Vòng lặp for
- Python Vòng lặp while
- Python Kiểu dữ liệu Number
- Python Kiểu dữ liệu String
- Python Kiểu dữ liệu List
- Python Kiểu dữ liệu Tuple
- Python Kiểu dữ liệu Dictionary
- Python Kiểu dữ liệu Set
- Python Kiểu dữ liệu Datetime
- Python Hàm Function
- Python Module
- Python File
- Python JSON
- Python NumPy
- Python Pandas
- Python MatPlotlib
- Machine Learning
- Lập trình Machine Learning-Python
- Machine Learning -Thuật toán Mean
- Machine Learning-Thuật toán Mode
- Machine Learning-Thuật toán Median
- Machine Learning-Standard Deviation
- Machine Learning - Thuật toán Percentiles
- Machine Learning - Normal Distribution
- Machine Learning-Thuật toán Simple Linear Regression
- Machine Learning - Thuật toán Polynomial Regression
- Machine Learning Thuật toán Multiple Regression
- Machine Learning - Thuật toán StandardScaler
- Machine Learning Train/Test
- Machine Learning - Thuật toán Decision Tree CART
- C#
- C # là gì ?
- C# IDE
- Cài Đặt Visual Studio IDE
- Code C# Hello World
- Code C# Output-Input
- C# Comment
- C# Kiểu Dữ Liệu
- C# Biến Variables
- C# Convert Data
- C# Các Phép Toán
- C# Hàm Toán Học
- C# String Methods
- C# Lệnh if...else
- C# Lệnh Switch...Case
- C# Vòng Lặp For
- C# Vòng Lặp Foreach
- C# Vòng Lặp While
- C# Lệnh Break - Continue
- C# Mảng Array
- C# Hàm Functions
- ASP.Net
- HTML
- Css
- Bootstrap
- React
- Lập trình nhúng C/C++
Menu
- Home
- Python
- Python là gì ?
- Python Cài đặt
- Python Tạo Project
- Python Cú pháp cơ bản
- Python Khai báo biến
- Python Các phép toán
- Python Lệnh if - else
- Python Vòng lặp for
- Python Vòng lặp while
- Python Kiểu dữ liệu Number
- Python Kiểu dữ liệu String
- Python Kiểu dữ liệu List
- Python Kiểu dữ liệu Tuple
- Python Kiểu dữ liệu Dictionary
- Python Kiểu dữ liệu Set
- Python Kiểu dữ liệu Datetime
- Python Hàm Function
- Python Class
- Python Module
- Python File
- Python JSON
- Python NumPy
- Python Pandas
- Python MatPlotlib
- Machine Learning
- Lập trình Machine Learning-Python
- Machine Learning -Thuật toán Mean
- Machine Learning-Thuật toán Mode
- Machine Learning-Thuật toán Median
- Machine Learning-Standard Deviation
- Machine Learning - Thuật toán Percentiles
- Machine Learning - Normal Distribution
- Machine Learning-Thuật toán Simple Linear Regression
- Machine Learning - Thuật toán Polynomial Regression
- Machine Learning Thuật toán Multiple Regression
- Machine Learning - Thuật toán StandardScaler
- Machine Learning Train/Test
- Machine Learning - Thuật toán Decision Tree CART
- Open CV - Python
- C#
- C # là gì ?
- C# IDE
- Cài Đặt Visual Studio IDE
- Code C# Hello World
- Code C# Output-Input
- C# Comment
- C# Kiểu Dữ Liệu
- C# Biến Variables
- C# Convert Data
- C# Các Phép Toán
- C# Hàm Toán Học
- C# String Methods
- C# Lệnh if...else
- C# Lệnh Switch...Case
- C# Vòng Lặp For
- C# Vòng Lặp Foreach
- C# Vòng Lặp While
- C# Lệnh Break - Continue
- C# Mảng Array
- C# Hàm Functions
- ASP.Net
- Code C#
- Code C# Windows Form
- Code C# Print Barcode Bartender
- Code C# Kết Nối Cân Điện Tử
- Code C# đọc file Excel
- Code C# Import Excel File To Database
- Code C# Import CSV File To Database
- Code C# Insert Multi Rows To Database SQL
- Code C# Insert Big Data to SQL Database
- C# Insert BulkCopy Big Data To SQL Database
- C# Insert Text and Image to a Column in SQL Database
- Code C# Read and Write data to COM Serial Port, R232
- Code C# Send Mail
- Code C# Send Mail Auto
- Code C# Web API
- SQL Server Database
- Oracle - PL/SQL
- Oracle Database là gì
- Cài Đặt Oracle Database trong windows
- Cách Tạo Database trong Oracle
- PL/SQL là gì?
- Cài Đặt PL/SQL Developer
- Oracle PL/SQL Kiểu Dữ Liệu
- Oracle PL/SQL Biến Variables
- Oracle PL/SQL If-Else
- Oracle PL/SQL Create View
- Oracle PL/SQL Create Function
- Oracle PL/SQL Create Procedure
- Oracle PL/SQL Create Package
- Oracle PL/SQL Create Trigger
- Oracle PL/SQL Create Table
- Oracle PL/SQL Create User
- HTML
- Css
- Jquery
- Bootstrap
- JavaScript
- React
- Công Nghệ
- Web Open Source
- Cách làm SEO Google
- Cách quảng cáo Google
- Cách làm Google adsense
- Cách làm Youtube
- Lập trình nhúng C/C++
- Lập Trình Arduino Uno
- Lập Trình STM32
- Lập Trình ESP32
- Tin Tức
- Home /
- Python MatPlotlib /
- Matplotlib Bar
HỌC LẬP TRÌNH
- Python
- Python NumPy
- Python Pandas
- Python MatPlotlib
- Machine Learning
- Open CV - Python
- C#
- ASP.Net
- Code C#
- Code C# Windows Form
- Code C# Web API
- SQL Server Database
- Oracle - PL/SQL
- HTML
- Css
- Jquery
- Bootstrap
- JavaScript
- React
- Công Nghệ
- Web Open Source
- Cách làm SEO Google
- Cách quảng cáo Google
- Cách làm Google adsense
- Cách làm Youtube
- Lập trình nhúng C/C++
- Lập Trình Arduino Uno
- Lập Trình STM32
- Lập Trình ESP32
Matplotlib Bar
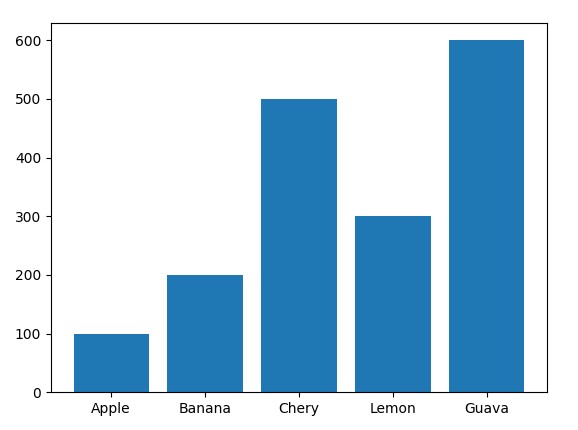
Vẽ biểu đồ cột trong python (Matplotlib Bar).
Bạn có thể sử dụng hàm bar() để vẽ biểu đồ cột trong python.
Ví dụ
import matplotlib.pyplot as plt
import numpy as np
import numpy as np
x = np.array(['Apple','Banana','Chery','Lemon', 'Guava'])
y = np.array([100,200,500,300,600])
plt.bar(x,y)
plt.show()
y = np.array([100,200,500,300,600])
plt.bar(x,y)
plt.show()
Kết quả:
Ngoài ra bạn còn có thể vẽ biểu đồ cột theo phương ngang (Horizontal Bars). Để vẽ biểu đồ cột theo phương ngang bạn sử dụng hàm barh().
Ví dụ
import matplotlib.pyplot as plt
import numpy as np
import numpy as np
x = np.array(['Apple','Banana','Chery','Lemon', 'Guava'])
y = np.array([100,200,500,300,600])
plt.barh(x,y)
plt.show()
y = np.array([100,200,500,300,600])
plt.barh(x,y)
plt.show()
Kết quả:
Học Lập Trình Web
Học Lập Trình
Bản quyền © 2026 ihoclaptrinh.com.
Powered by nopCommerce